
This appendix summarizes the jobs and cost calculations for two LNG power scenarios. Scenario 1 includes renewable electricity generation backed up by combined-cycle gas turbines and the B.C. Hydro grid. Scenario 2 considers D-Drives with heat recovery to generate electricity. Below we summarize methodology, results by Scenario, Data Sources and Calculations.
Methodology
We built off existing studies and information whenever possible and filled the gaps with new analysis when required. The following are our key assumptions, followed by our specific approach for the cost and jobs calculations.
LNG facility: The analysis is based on the energy required for three LNG facilities in Kitimat and Prince Rupert: LNG Canada, Prince Rupert LNG and Kitimat LNG. Combined, these facilities could produce 63 million tonnes per annum (MTA) of LNG. Since these facilities have yet to make final decisions on how they will be powered, and there is only preliminary data on the quantity of energy they will require, we estimated total power required at 45 MW per MTA for compression and ancillary requirements (Morgan, 2012). Prince Rupert LNG’s power requirements are 38 MW per MTA, while LNG Canada’s are between 50 and 56 MW per MTA depending on energy efficiency assumptions (AECOM, 2013; Stantec Consulting, 2013).
Renewable generation type: B.C. Hydro’s resource option report estimates 2.5 Gigawatt hours of wind energy potential in Northwestern British Columbia, with an average unit cost of energy at point of interconnection of $132 per MWhr (B.C. Hydro, 2013a). There are other energy opportunities in the region as well—including run-of-river hydroelectricity—but since the wind resource is relatively abundant, we consider only wind.
Renewable generation location: We did not pick a specific location for renewable energy resources, but all would be located on the North Coast.
Discount rate: We assumed a 10 percent discount rate for electricity generation and transmission projects and 15 percent discount rate for capital expenditures at the LNG facility. LNG projects have a higher risk profile than electricity generating projects and transmission lines, and we assume a higher discount rate.
Cost of gas: We assumed natural gas to feed the LNG facilities costs $4 per Gj, which includes production, processing and transmission to the LNG facilities.
Breakeven price of gas: We assume a breakeven price of gas of $11.08 per Gj based on break even cost estimates by Ernst & Young and Macquarie (Ernst & Young Global Ltd., 2013; Macquarie, 2012).
Carbon cost: We impose a $30 per tonne carbon tax and an LNG facility performance standard. The performance standard levies a penalty of $25 per tonne of CO2eq for every tonne of CO2eq above 0.14 tonnes CO2eq per tonne LNG. The 0.14 tonne CO2eq per tonne LNG is from our combined-cycle and renewable energy scenario in Cleanest LNG in the World?
Grid cost: We set the cost of grid electricity to $95 per MWhr, which is the marginal cost of electricity on the B.C. grid based on the addition of the proposed Site C Hydroelectric Project (B.C. Hydro, 2013b).
Cost calculation: Costs are calculated using simple levellized cost of electricity.
Combined cycle energy efficiency: 58 percent, which includes the cold climate efficiency advantage afforded LNG operators located in northern climates.
D-Drive with heat recovery and steam generated electricity: 50.6 percent.
Lifespan: We assume energy generating technologies have a 25-year lifespan, LNG facilities 25 years and transmission lines have a 50-year lifespan.
Jobs Calculation Methodology
We calculated jobs based on B.C. Hydro estimates (B.C. Hydro, 2013a) per generation type and then checked the results with industry experts in British Columbia. We consider only direct jobs during the operation phase of the LNG projects and associated energy production. Data sources are available in the Data Sources section.
Cost Calculation Methodology
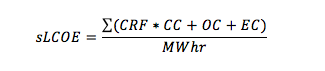
We used a simple levellized cost of energy (sLCOE) for each scenario. We used B.C. Hydro cost estimates for wind and combined-cycle power production in British Columbia and supplemented information gaps. Data sources are available in the Data Sources section.
Levellized Cost Calculations
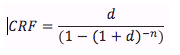
This equation converts capital costs into annual payments using a capital recovery factor and then adds the annual capital cost to annual operating and energy costs. We add the costs for each portion of the energy system (such as production and transmission) and then divide the total by MWhr produced per year to arrive at a cost per MWhr of energy.
Equation:
Where:
Capital Recovery Factor (CRF)
CC = Capital Cost
OC = Operating Cost
EC = Energy Cost
MWhr = Annual Megawatt hours of energy
d = Discount rate
n = Lifespan of technology
Results by Scenarios
Scenario 1: Maximum Renewables
In this scenario, we use a mix of wind – 2,265 MW installed capacity at a 0.33 capacity factor, combined-cycle – 2,265 MW installed capacity at a 0.75% capacity factor and grid electricity – 567 MW capacity at peak requirements, to power the prospective LNG facility. The scenario includes E-Drives at the LNG facilities, grid upgrades in Kitimat and Prince Rupert and twinning the transmission line between the Skeena Substation and Williston Substations. The following tables summarize costs in millions and jobs for this scenario.
|
Wind Farm |
Transmission Line |
B.C. Hydro Grid |
Combined-Cycle Power Plant |
E-Drive |
|
| Capital |
$7,772.47 |
$1,625.56 |
$- |
$2,576.22 |
$85.94 |
| Operating |
$115.09 |
$48.77 |
$- |
$594.23 |
$0.80 |
| Life Cycle Costs |
$939.59 |
$212.72 |
$320.52 |
$867.52 |
$14.10 |
|
Wind Farm |
Transmission Line |
B.C. Hydro Grid |
Combined-Cycle Power Plant |
E-Drive |
|
| Jobs Full Time Equivalent |
271.24 |
107.59 |
128.24 |
61.86 |
The total levellized cost is $94.88/MWhr.
Scenario 2: Renewable Ready
In this scenario the LNG facilities install E-Drives with electricity provide by natural gas fired combined-cycle turbines with an installed capacity of 2,832 MW.
| Combined-Cycle Power Plant | E-Drive | |
| Capital |
$3,220.27 |
$85.94 |
| Operating |
$1,028.42 |
$0.80 |
| Life Cycle Costs |
$1,370.03 |
$14.10 |
| Jobs Full Time Equivalent | Combined-Cycle Power Plant | E-Drive |
| Direct |
160.30 |
61.86 |
The total levellized cost for this scenario is $55.79/MWhr.
Scenario 3: Fossil Energy
In this scenario, the LNG facility is powered by D-Drive natural gas turbines; heat recovery and steam generation produce electricity. The combined system has an installed capacity of 2,832 MW – electrical and mechanical power.
| D-Drive | |
| Capital |
$3,220.27 |
| Operating |
$1,172.87 |
| Life Cycle Costs |
$1,663.32 |
| D-Drive | |
| Jobs Full Time Equivalent |
160.30 |
The total levellized cost for this scenario is $67.05/MWhr.
Data Sources
Table 5: Summary of cost data sources
|
Component |
Assumptions |
| Cost – Combined-cyclecapital, operating, maintenance, fuel | Combined-cycle capital and operating costs from B.C. Hydro – (2013)Fuel cost calculated based on cost of natural gas and efficiency in assumptions. |
| Cost – Windcapital, operating, maintenance, | B.C. Hydro Resource Assessment, North Coast Wind.Estimates confirmed with Alterra Energy, Personal Communication |
| Cost – Grid | Estimate of Site C cost $95/MWhr (B.C. Hydro 2013a) |
| Cost – Electric motor | 1/3 cost of single cycle power generation from (B.C. Hydro) |
| Transmission Capacity | Golder Associates Ltd. (2007)For transmission to KitimatBritish Columbia Transmission Corporation. (2007)For system upgrades in Kitimat
Twinning transmission between Skeena and Williston substations (B.C. Hydro 2013a) Operating costs estimated at 3 percent of capital cost Silverstein, A. (2011) |
Table 5: Summary of data sources for jobs
|
Information Required |
Sources |
| Jobs direct – Wind | B.C. Hydro Resource Assessment (B.C. Hydro 2013a) supported by discussion with renewable energy industry |
| Jobs direct – Combined-cycle | B.C. Hydro Resource Assessment (B.C. Hydro 2013a) Backed up by discussion with renewable energy industry |
Bibliography
AECOM. (2013). Project Description: Prince Rupert LNG. Vancouver. Retrieved from http://a100.gov.bc.ca/appsdata/epic/documents/p402/d35568/1367597846227_cd923f726e6163a34f51cad80e3c4736296240fe17144d5b554ddd0f94716141.pdf
B.C. Hydro. (2013a). 2013 Resource Options Report Update Appendix 3 Resource Options Database ( RODAT ) Summary Sheets. Retrieved from http://www.bchydro.com/content/dam/BCHydro/customer-portal/documents/corporate/regulatory-planning-documents/integrated-resource-plans/current-plan/ror-update-appx-3-20130802.pdf
B.C. Hydro. (2013). Integrated Resource Plan: Chapter 1 Introduction and Context. Vancouver. Retrieved from http://www.bchydro.com/content/dam/BCHydro/customer-portal/documents/corporate/regulatory-planning-documents/integrated-resource-plans/current-plan/0001-nov-2013-irp-chap-1.pdf
B.C. Hydro. (2013b). Site C Clean Energy Project : Business Case Summary. Vancouver, B.C. Retrieved from http://www.bchydro.com/content/dam/BCHydro/customer-portal/documents/projects/site-c/site-c-business-case-summary.pdf
British Columbia Transmission Corporation. (2007). Feasibility Study For the Banks Island North Wind Farm Project Of XXXX. Retrieved from http://transmission.bchydro.com/nr/rdonlyres/9e01facf-5290-44ac-bc71-be20d322b69c/0/banksislandnorthwindfarmippfeasibilitystudy.pdf
Chevron. (2009). Gorgon Gas Development and Jansz Feed Gas Pipeline (pp. 0–58). Retrieved from http://www.chevronaustralia.com/Libraries/Chevron_Documents/GGAP_Rev_0_G1-NT-PLNX0000012.pdf.sflb.ashx
Clean Energy Canada at Tides Canada (2013). “POLL: British Columbians Expect LNG to be World’s Cleanest.” (Media release.) Retrieved from https://cleanenergycanada.org/2013/10/09/poll-british-columbians-expect-lng-worlds-cleanest/
Ernst & Young Global Ltd. (2013). Global LNG: Will new demand and new supply mean new pricing? Retrieved from http://www.ey.com/Publication/vwLUAssets/Global_LNG_New_pricing_ahead/$FILE/Global_LNG_New_pricing_ahead_DW0240.pdf
GDF Suez Canada. (2013). LNG Terminal Power Proposal. Vancouver, B.C.
Glave, James and Moorhouse, Jeremy. Clean Energy Canada at Tides Canada (2013). The Cleanest LNG in the World? How to Slash Carbon Pollution From Wellhead to Waterline in British Columbia’s Proposed Liquefied Natural Gas Industry. Retrieved from https://cleanenergycanada.org/LNG
Golder Associates Ltd. (2007). Banks Island North Wind Energy Project: Project Description. Victoria, B.C. Retrieved from https://a100.gov.bc.ca/appsdata/epic/documents/p292/d23948/1179857575962_f7cdb61e950b41bba15b9579e164a287.pdf
Golder Associates Ltd. (2013). Woodfibre LNG Executive Summary. Vancouver. Retrieved from http://www.ceaa-acee.gc.ca/050/documents/p80060/97118E.pdf
Kariya, Paul (2013). Generate B.C. 2013. Economic Impact of the Clean Energy Sector on First Nations in B.C.
Macquarie. (2012). Canadian LNG: The race to the coast. Retrieved from http://www.investorvillage.com/uploads/8056/files/Cdn_LNG_100912.pdf
Ministry of Energy and Mines. (2013). Liquefied Natural Gas A Strategy for B.C.’s Newest Industry (p. 12). Victoria.
Moorhouse, Jeremy and Knox, Greg. 2013. SkeenaWild Conservation Trust. Air Advisory: The Air Quality Impacts of Liquefied Natural Gas operations Proposed for Kitimat B.C. Retrieved from http://skeenawild.org/news/air-advisory-the-air-quality-impacts-of-liquefied-natural-gas-operations-proposed-for-kitimat-bc/
Morgan, J. (2012). Rules of Thumb for Screening LNG Developments. Perth. Retrieved from http://www.engineersaustralia.org.au/sites/default/files/shado/Divisions/Western AustraliaDivision/Groups/Oil_Gas/lng_technical_presentation_ieaustralia_oil_and_gas_division_perth_october_2012.pdf
Sayers, Judith. “Include First Nations in renewable energy sector Opinion: B.C. must live up to promises; native projects could power LNG industry.” The Vancouver Sun, October 25, 2013. Retrieved from: http://www.vancouversun.com/business/Include+First+Nations+renewable+energy+sector/9085017/story.html
Silverstein, A. (2011). Transmission 101. Retrieved from http://www.naruc.org/grants/Documents/Silverstein NCEP T-101 0420111.pdf
Stantec Consulting Ltd. (2013). Project Description: LNG Canada (p. 74). Vancouver. Retrieved from http://a100.gov.bc.ca/appsdata/epic/documents/p398/1365026171573_b10c96a610dc0c0f851c949b68e76230b10e12c187e22b33b315f1630c0223a8.pdf
U.S. Energy Information Administration. (2013). Natural Gas. Short-Term Energy Outlook. Retrieved from http://www.eia.gov/forecasts/steo/report/natgas.cfm


